Taxonomy: Class: Mammalia; Order: Carnivora; Family: Canidae
Description
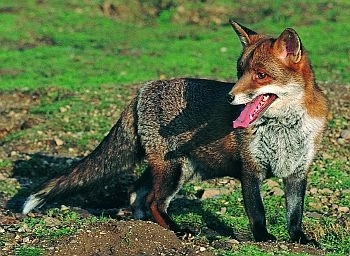
Fox © Alexis de la Serre
The fox is a highly adaptable carnivore related to the domestic dog. It is reddish-brown above and white underneath, with a large white-tipped bushy tail. It is found in a wide variety of upland and lowland habitats, and has taken readily to suburban and urban environments (Harris 1986). The diet is wide-ranging, and includes invertebrates, birds, mammals, carrion and fruit. Because the fox can take poultry, lambs, gamebirds and other wildlife including species of conservation concern, it is one of the main subjects of predator control (Reynolds & Tapper 1996). It may be shot or trapped all year round.
Further information:
Mammal Society website fox page.
Conservation status and legislation
Status:
UK: Native
World: Least Concern (IUCN Red List)
Legislation:
Distribution and abundance
The fox is widespread across the whole of mainland Britain and the Isle of Wight. It is absent from the Scilly Isles, Isle of Man, Channel Islands and all Scottish islands except Skye and Harris. It is found throughout Ireland, although a scarcity of records means that this is not apparent from the map.
Estimates of fox abundance (numbers of individuals in the spring) across the UK, from Harris et al. (1995):
A more recent estimate from Natural England and the Mammal Society (Mathews et al 2018) put the total UK fox population at 357,000.
Recent trends from the National Gamebag Census
United Kingdom
Index of bag density from 1961 to 2009 (see statistical methods and interpretational considerations).
Error bars represent 95% confidence intervals.
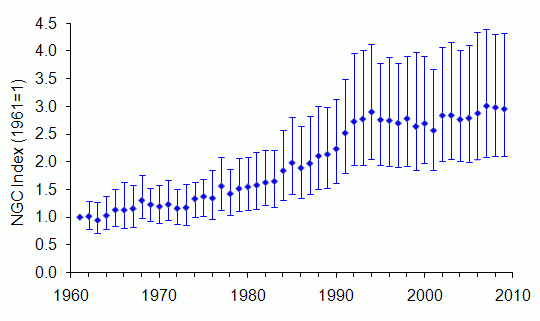
There has been a continuous increase in the bag index, particularly between 1961 and the early 1990s. Overall the bag index has tripled between 1961 and 2009. Fox density may have been depressed following the disappearance of their rabbit prey due to myxomatosis in the 1950s, and part of the increase may reflect the subsequent rabbit recovery. Changes in fox control methods, including the use of spotlights for night shooting and the banning of Cymag poison, have undoubtedly affected the size of the cull. The widespread rearing and releasing of gamebirds has probably improved fox food supply in autumn and winter.
Change in fox bags over time, with 95% confidence limits (see statistical methods):
| Country |
Sites |
Start
year |
End
year |
Change (%)
1961-2009 |
Change (%)
1984-2009 |
Change (%)
1995-2009 |
| United Kingdom |
1185 |
1961 |
2009 |
203*
130 to 290 |
62*
46 to 81 |
11*
1 to 21 |
* significant at P < 0.05
England
Index of bag density from 1961 to 2009 (see statistical methods and interpretational considerations).
Error bars represent 95% confidence intervals.
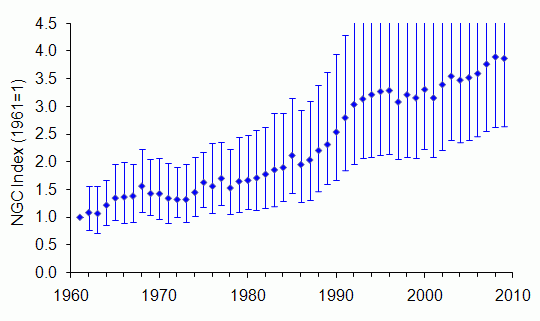
There has been a continuous increase in the bag index since 1961, leading to it being more than three times higher in 2009 than in 1961. Fox density may have been depressed following the disappearance of their rabbit prey due to myxomatosis in the 1950s, and part of the increase may reflect the subsequent rabbit recovery. Changes in fox control methods, including the use of spotlights for night shooting and the banning of Cymag poison, have undoubtedly affected the size of the cull. The widespread rearing and releasing of gamebirds has probably improved fox food supply in autumn and winter.
Change in fox bags over time, with 95% confidence limits (see statistical methods):
| Country |
Sites |
Start
year |
End
year |
Change (%)
1961-2009 |
Change (%)
1984-2009 |
Change (%)
1995-2009 |
| England |
821 |
1961 |
2009 |
258*
171 to 423 |
97*
73 to 123 |
26*
13 to 39 |
* significant at P < 0.05
Scotland
Index of bag density from 1961 to 2009 (see statistical methods and interpretational considerations).
Error bars represent 95% confidence intervals.
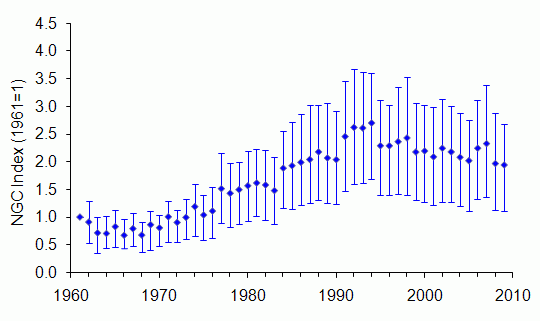
The bag index more than doubled between 1961 and 1994, then declined significantly from 1995 to 2009. Fox density may have been depressed following the disappearance of their rabbit prey due to myxomatosis in the 1950s, and part of the increase may reflect the subsequent rabbit recovery. Changes in fox control methods, including the use of spotlights for night shooting and the banning of Cymag poison, have undoubtedly affected the size of the cull. The widespread rearing and releasing of gamebirds has probably improved fox food supply in autumn and winter. The reason for the recent decline is unknown.
Change in fox bags over time, with 95% confidence limits (see statistical methods):
| Country |
Sites |
Start
year |
End
year |
Change (%)
1961-2009 |
Change (%)
1984-2009 |
Change (%)
1995-2009 |
| Scotland |
308 |
1961 |
2009 |
150*
50 to 262 |
11
-9 to 32 |
-15*
-29 to -3 |
* significant at P < 0.05
Wales
Index of bag density from 1961 to 2009 (see statistical methods and interpretational considerations).
Error bars represent 95% confidence intervals.
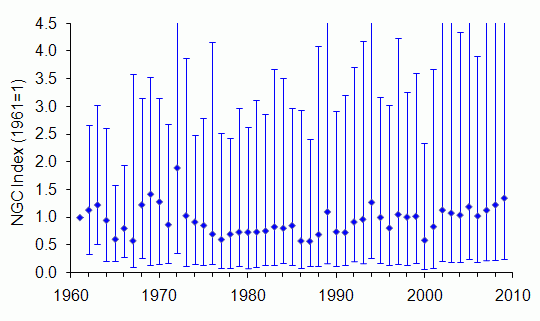
There is no evidence that the bag index has changed between 1961 and 2009.
Change in fox bags over time, with 95% confidence limits (see statistical methods):
| Country |
Sites |
Start
year |
End
year |
Change (%)
1961-2009 |
Change (%)
1984-2009 |
Change (%)
1995-2009 |
| Wales |
37 |
1961 |
2009 |
24
-62 to 316 |
67
-12 to 137 |
33
-12 to 80 |
* significant at P < 0.05
N Ireland
There are too few bag records of fox to produce an index graph. 
There are too few bag records of fox to evaluate rates of change over time
| Country |
Sites |
Start
year |
End
year |
Change (%)
1961-2009 |
Change (%)
1984-2009 |
Change (%)
1995-2009 |
| N Ireland |
Too few sites |
Environmental zones
Change in fox bags over time, with 95% confidence limits (see statistical methods):
| Environmental zone |
Sites |
Start
year |
End
year |
Change (%)
1961-2009 |
Change (%)
1984-2009 |
Change (%)
1995-2009 |
| Easterly lowlands (England/Wales) |
523 |
1961 |
2009 |
370*
232 to 630 |
112*
79 to 150 |
26*
11 to 42 |
| Westerly lowlands (England/Wales) |
214 |
1961 |
2009 |
111*
19 to 242 |
86*
50 to 134 |
36*
12 to 74 |
| Uplands (England/Wales) |
120 |
1961 |
2009 |
91*
40 to 437 |
64*
23 to 107 |
16
-4 to 39 |
| Lowlands (Scotland) |
92 |
1961 |
2009 |
240*
22 to 514 |
38*
1 to 86 |
0
-21 to 25 |
| Intermediate uplands/islands (Scotland) |
51 |
1961 |
2009 |
49
-14 to 211 |
30
-15 to 143 |
1
-23 to 24 |
| True uplands (Scotland) |
170 |
1961 |
2009 |
102*
17 to 227 |
-10
-49 to 45 |
-27*
-42 to -9 |
* significant at P < 0.05
Comparison with BBS mammal data
Since 1995, data on fox abundance have been collected under the Breeding Bird Survey (BBS) organised by the British Trust for Ornithology. Below, the UK trend from the NGC is compared to the one from the BBS (from 1995 onwards).
NGC index of bag density (blue) and BBS index of abundance (red), from 1995 to 2009.
Error bars represent 95% confidence intervals.
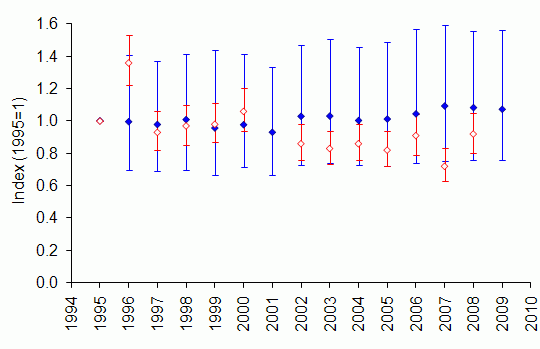
The BBS reported a relatively stable trend since the start of the survey in 1995. The NGC fox bag trend showed a small but significant increase during the same period. However, the BBS confidence intervals fall completely or almost completely within the NGC confidence intervals, suggesting that the two surveys are measuring the same trend.
Long-term trend from the National Gamebag Census
There are too few bag records of fox to produce a trend starting before 1961.
References and further reading
- Battersby,J. (2005). UK Mammals: Species Status and Population Trends. Joint Nature Conservation Committee/Tracking Mammals Partnership, Peterborough (JNCC download page).
- Harris,S. (1986). Urban Foxes. Whittet Books, London.
- Harris,S., Morris,P., Wray,S. & Yalden,D.W. (1995). A Review of British Mammals: Population Estimates and Conservation Status of British Mammals Other than Cetaceans. Joint Nature Conservation Committee, Peterborough (JNCC download page).
- Harris,S. & Yalden,D.W. (2008). Mammals of the British Isles: Handbook, 4th edition. Mammal Society, Southampton.
- Reynolds,J.C. & Tapper,S.C. (1996). Control of mammalian predators in game management and conservation. Mammal Review 26: 127-156.
This report should be cited as: Aebischer,N.J., Davey,P.D. & Kingdon,N.G. (2011). National Gamebag Census: Mammal Trends to 2009. Game & Wildlife Conservation Trust, Fordingbridge (http://www.gwct.org.uk/ngcmammals).
Return to species list