Taxonomy: Class: Mammalia; Order: Artiodactyla; Family: Cervidae
Description
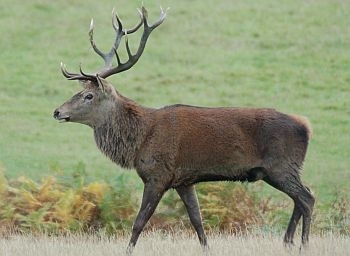
Red deer © Peter Thompson
The red deer is the largest land animal in the UK, standing over 1.2 m to the shoulder. The male has large antlers, shed in winter. The species was extinct across much of England, Wales and lowland Scotland by the late 1700s owing to deforestation and human disturbance. It subsequently increased in Scotland because of the stalking interest. The red deer is most widespread on moorland, but is also found in woodland and farmland fringes. It can cause considerable damage to forestry, and to a lesser extent to agricultural crops. Stags may be shot from 1 August to 30 April, hinds from 1 November to 31 March.
Further information:
Mammal Society website red deer page.
Conservation status and legislation
Status:
UK: Native
World: Least Concern (IUCN Red List)
Legislation:
Distribution and abundance
The red deer's traditional stronghold is in Scotland, particularly the Highlands, the south-west and the major islands. There are concentrations also in north-west and south-west England, Hampshire and East Anglia. Numerous other scattered populations exist across England, Wales and N Ireland.
Estimates of red deer abundance (numbers of individuals in the spring) across the UK, from Harris et al. (1995):
Recent trends from the National Gamebag Census
United Kingdom
Index of bag density from 1961 to 2009 (see statistical methods and interpretational considerations).
Error bars represent 95% confidence intervals.
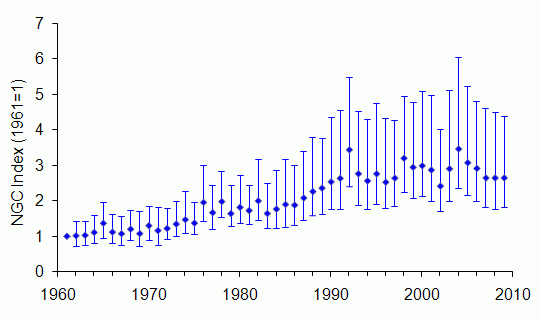
There has been a significant increase in the bag index between 1961 and 2009, with stabilisation between 1995 and 2009. This reflects the ongoing range expansion and increasing abundance of the species (see maps) as it recovered from its past very low densities across much of the UK. The increase was probably due to a combination of underculling of females, improved food resources through afforestation, milder winters leading to better overwinter survival and reduced competition with hill sheep.
Change in red deer bags over time, with 95% confidence limits (see statistical methods):
| Country |
Sites |
Start
year |
End
year |
Change (%)
1961-2009 |
Change (%)
1984-2009 |
Change (%)
1995-2009 |
| United Kingdom |
246 |
1961 |
2009 |
174*
85 to 376 |
40*
23 to 60 |
-1
-9 to 7 |
* significant at P < 0.05
England
Index of bag density from 1983 to 2009 (see statistical methods and interpretational considerations).
Error bars represent 95% confidence intervals.
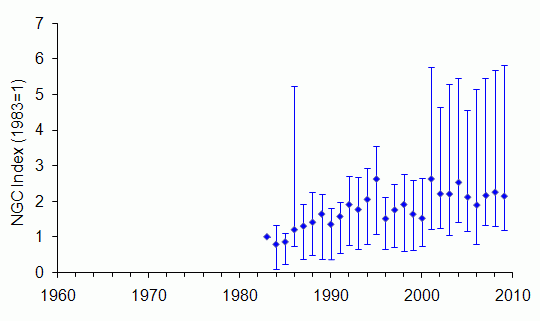
There has been a significant increase in the index of bag density between 1983 and 1995, with stabilisation between 1995 and 2009. Although no sites reported bags during the 1960s, two sites reported the animal during the 1970s. This reflects the ongoing range expansion and increasing abundance of the species (see maps) as it recovered from its past very low densities. The increase was probably due to a combination of underculling of females, improved food resources through afforestation, milder winters leading to better overwinter survival and reduced competition with hill sheep.
Change in red deer bags over time, with 95% confidence limits (see statistical methods):
| Country |
Sites |
Start
year |
End
year |
Change (%)
1961-2009 |
Change (%)
1984-2009 |
Change (%)
1995-2009 |
| England |
39 |
1983 |
2009 |
158*
72 to 609 |
133*
63 to 532 |
12
-36 to 185 |
* significant at P < 0.05
Scotland
Index of bag density from 1961 to 2009 (see statistical methods and interpretational considerations).
Error bars represent 95% confidence intervals.
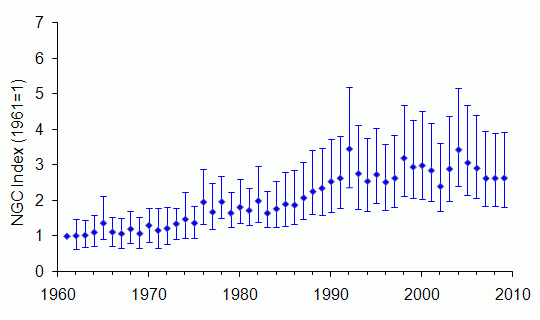
There has been a significant increase in the index of bag density between 1961 and 1992, with stabilisation between 1995 and 2009. This reflects ongoing husbandry by stalking interests and range expansion in the lowlands (see maps) as the species recovers from its past low densities. The increase was probably also helped by underculling of females, improved food resources through afforestation, milder winters leading to better overwinter survival and reduced competition with hill sheep.
Change in red deer bags over time, with 95% confidence limits (see statistical methods):
| Country |
Sites |
Start
year |
End
year |
Change (%)
1961-2009 |
Change (%)
1984-2009 |
Change (%)
1995-2009 |
| Scotland |
203 |
1961 |
2009 |
173*
73 to 369 |
39*
22 to 57 |
-1
-9 to 7 |
* significant at P < 0.05
Wales
There are too few bag records of red deer to produce an index graph. 
There are too few bag records of red deer to evaluate rates of change over time
| Country |
Sites |
Start
year |
End
year |
Change (%)
1961-2009 |
Change (%)
1984-2009 |
Change (%)
1995-2009 |
| Wales |
Too few sites |
N Ireland
There are too few bag records of red deer to produce an index graph. 
There are too few bag records of red deer to evaluate rates of change over time
| Country |
Sites |
Start
year |
End
year |
Change (%)
1961-2009 |
Change (%)
1984-2009 |
Change (%)
1995-2009 |
| N Ireland |
Too few sites |
Environmental zones
Change in red deer bags over time, with 95% confidence limits (see statistical methods):
| Environmental zone |
Sites |
Start
year |
End
year |
Change (%)
1961-2009 |
Change (%)
1984-2009 |
Change (%)
1995-2009 |
| Easterly lowlands (England/Wales) |
26 |
1995 |
2009 |
no data |
no data |
-10
-53 to 269 |
| Westerly lowlands (England/Wales) |
Too few sites |
| Uplands (England/Wales) |
Too few sites |
| Lowlands (Scotland) |
16 |
1961 |
2009 |
142*
80 to 175 |
15
-17 to 65 |
3
-32 to 59 |
| Intermediate uplands/islands (Scotland) |
34 |
1961 |
2009 |
151*
18 to 840 |
35*
10 to 70 |
-7
-16 to 5 |
| True uplands (Scotland) |
154 |
1961 |
2009 |
181*
67 to 401 |
41*
21 to 65 |
0
-10 to 12 |
* significant at P < 0.05
Comparison with BBS mammal data
Since 1995, data on red deer abundance have been collected under the Breeding Bird Survey (BBS) organised by the British Trust for Ornithology. Below, the UK trend from the NGC is compared to the one from the BBS (from 1995 onwards).
NGC index of bag density (blue) and BBS index of abundance (red), from 1995 to 2009.
Error bars represent 95% confidence intervals.
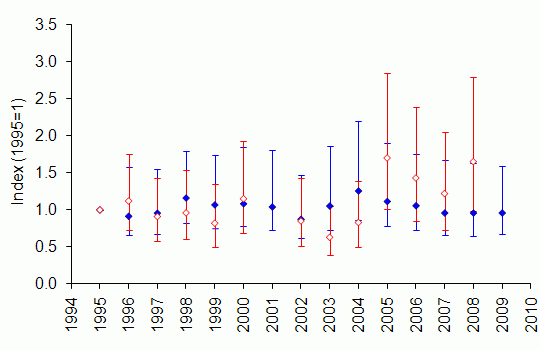
The BBS and NGC trends in red deer indices have been relatively stable between 1995 and 2008, with no significant increases. The confidence intervals of the BBS and NGC estimates overlap widely, suggesting that the two surveys are measuring the same trend.
Long-term trend from the National Gamebag Census
Index of bag density from 1901 to 2009 (see statistical methods and interpretational considerations).
Error bars represent 95% confidence intervals.
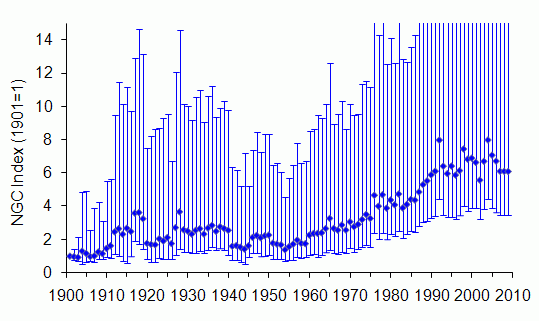
The bag index was relatively stable up to the 1960s, but then underwent a significant and sustained increase until 1995, when it again stablised. The period of increase reflects the ongoing range expansion and increasing abundance of the species (see maps) as it recovered from its past low densities. Why the increase began when it did was probably due to a combination of underculling of females, improved food resources through afforestation, milder winters leading to better overwinter survival and reduced competition with hill sheep.
References and further reading
- Battersby,J. (2005). UK Mammals: Species Status and Population Trends. Joint Nature Conservation Committee/Tracking Mammals Partnership, Peterborough (JNCC download page).
- Clutton-Brock,T.H. & Albon,S.D. (1989). Red Deer In the Highlands. BSP Professional Books, Blackwell, London.
- Deer Initiative (2008). Species Ecology: Red Deer. England & Wales Best Practice Guides, The Deer Initiative, Chirk (PDF file - 4,682 KB).
- Harris,S., Morris,P., Wray,S. & Yalden,D.W. (1995). A Review of British Mammals: Population Estimates and Conservation Status of British Mammals Other than Cetaceans. Joint Nature Conservation Committee, Peterborough (JNCC download page).
- Harris,S. & Yalden,D.W. (2008). Mammals of the British Isles: Handbook, 4th edition. Mammal Society, Southampton.
This report should be cited as: Aebischer,N.J., Davey,P.D. & Kingdon,N.G. (2011). National Gamebag Census: Mammal Trends to 2009. Game & Wildlife Conservation Trust, Fordingbridge (http://www.gwct.org.uk/ngcmammals).
Return to species list