Research
Grey partridge releasing experiment
Long-term trends in grey partridge abundance
Grey partridge diet and parasite infection
A Sussex success story
Interreg PARTRIDGE Project
Grey partridge winter loss study
Partridges and raptors
Grey partridges and land use in Norfolk
Chick Food Index
Habitat use and chick diet of grey partridge living on Pennine hill farms
Scottish Grey Partridge Project
Improving over-winter feeding
What insects do partridge chicks prefer?
Winter hopper feeder study
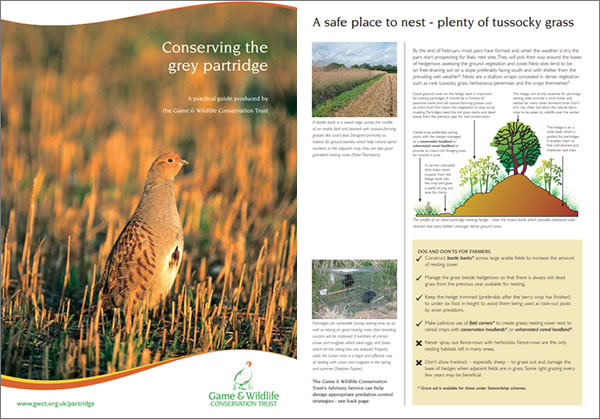
Our free colour 8-page guide contains vital information about grey partridge, including advice on what you can do to reverse their decline.
Download FREE >