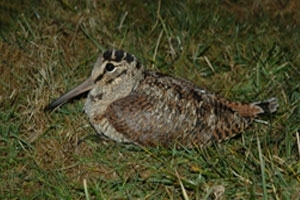
 The latest survey of the UK’s resident woodcock population saw the highest ever participation rate since the count began 20 years ago.
Run by the Game & and Wildlife Conservation Trust (GWCT) and the British Trust for Ornithology (BTO), the Breeding Woodcock Survey aims to gather up-to-date evidence on the size and distribution of this elusive Red-Listed, woodland-dwelling wader, which helps to inform woodcock conservation.
The survey looks at birds that are present all year round and breed in the UK. It was first carried out in 2003, repeated in 2013 and again this year.
In total, 1,230 randomly selected sites in the UK were surveyed, compared to a total of around 820 in 2003 and 2013.
This year was also the first real survey of woodcock breeding in Northern Ireland, where previously the number of sites – just three – has been too small to produce an accurate estimate of the population. This time around, 38 sites were surveyed with funding from BASC.
The final results of the 2023 survey are expected by spring 2024, but there are concerns the population is continuing to decline.
Volunteers make it possible
 Dr Chris Heward, of the GWCT, which leads the way in woodcock research in the UK, said: “Our last national survey in 2013 estimated that around 55,000 male woodcock breed in Britain, but also highlighted a 29% decline in numbers between 2003 and 2013.
“Understanding how woodcock populations have changed since 2013, and whether such severe declines have continued, is a priority for the GWCT.”
The 2023 survey saw a network of volunteer surveyors, co-ordinated by the BTO, visiting sites across the UK to carry out dusk counts of displaying male woodcock.
In spring and summer, they perform wandering twilight flights over the woodland canopy, squeaking and grunting as they go, searching for females who await in glades and rides below. These ‘roding’ flights provide a means of counting an otherwise inconspicuous species.
From a randomly selected list of 2,700 woodland sites, surveyors were invited to select one and asked to make up to three roding count visits. During a 75-minute period, beginning 15 minutes before sunrise, they recorded each separate woodcock sighting.
Chris continued: “We are pleased to announce that 2023 saw unprecedentedly high participation in the Breeding Woodcock Survey – breaking all previous records.
“We are grateful to all volunteers who took part in the breeding woodcock survey and submitted their data in time. Without them the survey would be impossible.
“We are particularly indebted to those that undertook remote or hard-to-reach areas, which has really boosted the representation in Scotland, Northern England and Wales.
“Equally, we are grateful to those of you who surveyed sites where woodcock were absent – although disheartening, these counts are just as important.”
This level of coverage allows the final dataset to capture a wider and more representative range of sites, and this makes final estimates of population size and trend more accurate.
12 custom regions underpin the final population estimates – these are used to account for regional variation in woodcock abundance. All these regions achieved higher coverage than previous surveys. This ensures accurate representation of more remote areas – such as northern England and Scotland – which support a large proportion of Britain’s breeding woodcock.
“The analysis of this data is already well underway,” said Chris. “We hope that the first estimates of population size and change will be made available in the early part of next year. These results will give a vitally important insight into the state of woodcock in the British Isles.”
Breakdown of regional survey coverage in 2023 and 2013 – all areas saw an increase in participation
| Survey region |
Total surveyed
(random and
self-selected) |
Total number of
random squares
surveyed in 2023 |
Total number of
random squares
surveyed in 2013 |
Increase |
| North Scotland |
71 |
58 |
35 |
23 (65.7%) |
| South Scotland |
98 |
78 |
34 |
44 (129.4%) |
| Northern England |
63 |
56 |
35 |
21 (60%) |
| Northern Ireland |
48 |
38 |
3 |
35 (1166.7%) |
| Eastern England |
68 |
63 |
47 |
16 (34%) |
| North Midlands |
140 |
127 |
76 |
51 (67.1%) |
| Wales |
77 |
75 |
30 |
45 (150%) |
| South Midlands |
102 |
101 |
84 |
17 (20.2%) |
| East Anglia |
139 |
136 |
90 |
46 (51.1%) |
| South-east England |
225 |
213 |
172 |
41 (23.8%) |
| Central South |
161 |
151 |
84 |
67 (79.8%) |
| South-west England |
144 |
134 |
124 |
10 (8.1%) |
| UK |
1,343 |
1,230 |
814 |