As well as bags of gamebirds and mammals, the National Gamebag Census (NGC) collates information on the numbers of native and introduced deer that have been shot each year on the area managed by contributing shoots.
Our participation in the Tracking Mammals Partnership has prompted us to examine, for the first time, the trends in numbers of deer shot in different parts of Great Britain between 1960 and 1999. Too few records of Sika and Chinese water deer were available for analysis, so we concentrated on roe deer, fallow deer, red deer and Chinese muntjac.
We split the data according to decade (1960-1969, 1970-1979, 1980-1989 and 1990-1999). For each decade, we then summed all the records of numbers shot within each county across England, Wales and Scotland, and also summed the areas shot over.
Dividing one by the other gave a deer bag density for each county over that period, which we then mapped according to six colour-coded categories of abundance (the palest shade corresponding to the lowest bag density, the darkest shade depicting the highest density, on a geometric scale). This gave us four maps per deer species, showing how distribution and abundance had changed from decade to decade. Sadly, we had too few records from Northern Ireland to be able to include it in this mapping excercise.
Roe deer
The expansion of the roe deer is spectacular. In the 1960s, bags were restricted to Scotland, north-east England and a handful of southern counties. Ten years later, it had consolidated its hold throughout the northern half of Britain and across practically all southern-most counties.
Thereafter the expansion swept through East Anglia and density generally increased, especially in the south where bag density now exceeds one per 100 hectares. Throughout the period, little change occurred in Wales and the Midlands, where very few roe deer are shot.
Roe deer bag density (number shot per 100 hectares) synoptically by county and by decade from 1960 to 1999

Fallow deer
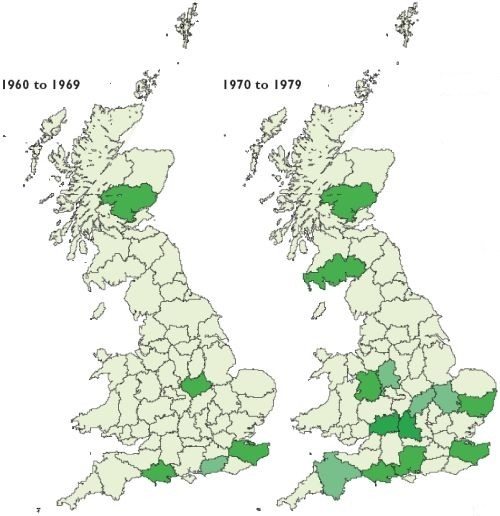
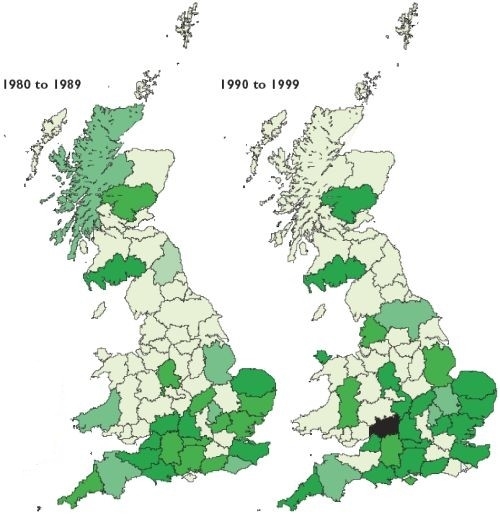
The expansion of the fallow deer is equally as impressive, but has taken place mainly in the southern half of Britain. In the 1960s, it was shot in only a few localities, then began to make a sporadic appearance in other county bags in the 1970s. By the 1980s, its distribution was almost continuous south of a line from the Bristol Channel to the Wash, and density has increased since then.
In Scotland, the fallow deer has been shot in Tayside throughout the period, and expanded primarily into Dumfries and Galloway. Numbers shot have remained very low elsewhere.
Fallow deer bag density (number shot per 100 hectares) synoptically by county and by decade from 1960 to 1999

Red deer
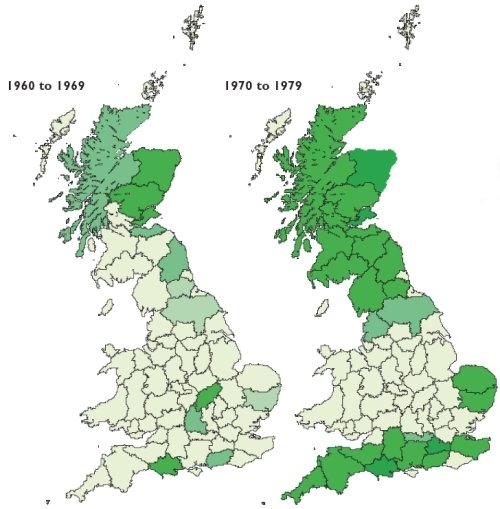
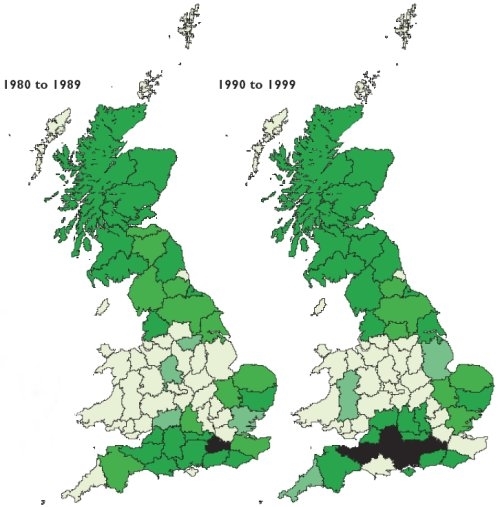
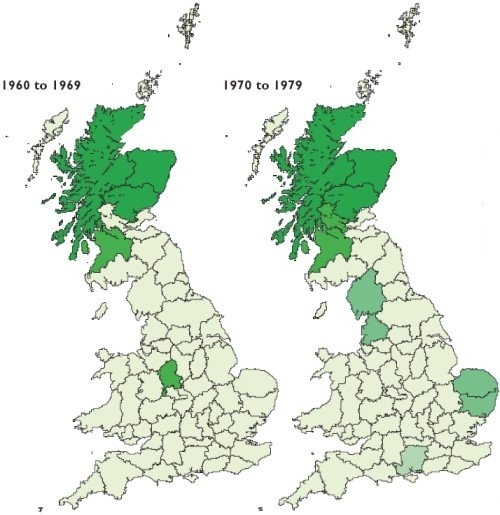
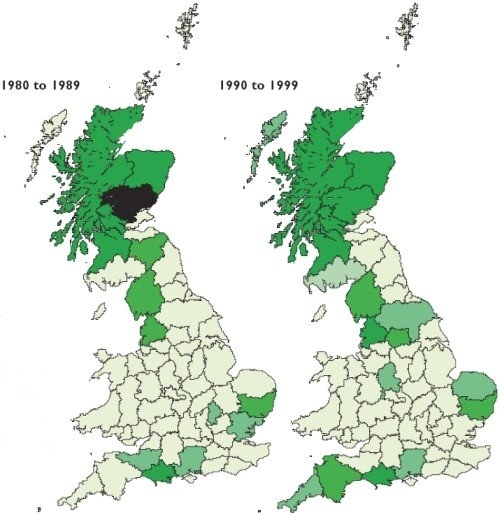
Traditionally, the Scottish Highlands have been the stronghold of the red deer in Britain, and the maps indicate that the densities shot there have remained roughly constant throughout. In the 1960s, very low numbers were also shot in Strathclyde and Staffordshire.
Over the next three decades, shooting gradually increased in south-west Scotland, north-west England, East Anglia and, recently, in south-west England. Over the 40-year period, no red deer were shot in Wales, the Midlands or south-east England.
Red deer bag density (number shot per 100 hectares) synoptically by county and by decade from 1960 to 1999

Muntjac
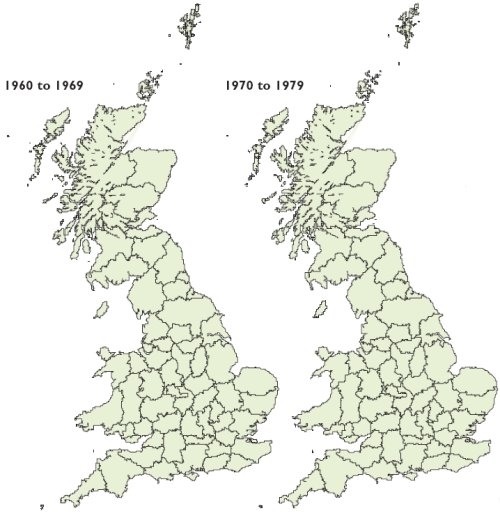
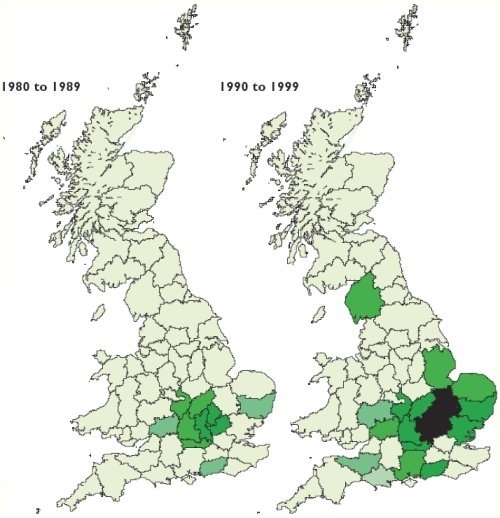
This species was originally introduced to Woburn Park, Bedfordshire, in 1894. Subsequent escapes led to its establishment in the wild towards the middle of the 20th century, and surreptitious releases have hastened its spread. The first muntjacs appeared in NGC records during the 1980s, primarily between London and the Severn estuary.
By the 1990s, they were being shot from the southern Welsh border across to East Anglia and central southern England. Densities shot are especially high in the Home Counties.
Muntjac bag density (number shot per 100 hectares) synoptically by county and by decade from 1960 to 1999
